
Creating a Map With a Large Language Model
June 23, 2026

I’ve held off on writing a newsletter on building maps with AI tools. I’ve found them to be unreliable, but have seen a breakthrough in the past few weeks when I was at an OSINT training at the University of Wisconsin Public Tech Media Lab.
The epiphany came during a data exercise with Guillén Torres, a specialist in action research, methodological experimentation, and data-driven technologies for justice and accountability UC Berkeley Human Rights Center. He gave us a dataset of larger U.S. landfills to analyze. Then he asked us to see if we could get it to design a static or interactive map in a Large Language Model.
Whenever I work with LLMs, I try my prompts in a few models, specifically ChatGPT, Claude and Google Gemini. I want to pit them against one another to see which is best at a specific task.
For my landfill data, ChatGPT took a few tries to get a static chart. But Claude built a static and interactive chart on the second try. I also asked it to build a data dictionary and it built a beautiful table with column definitions and clarified a few categories accurately.
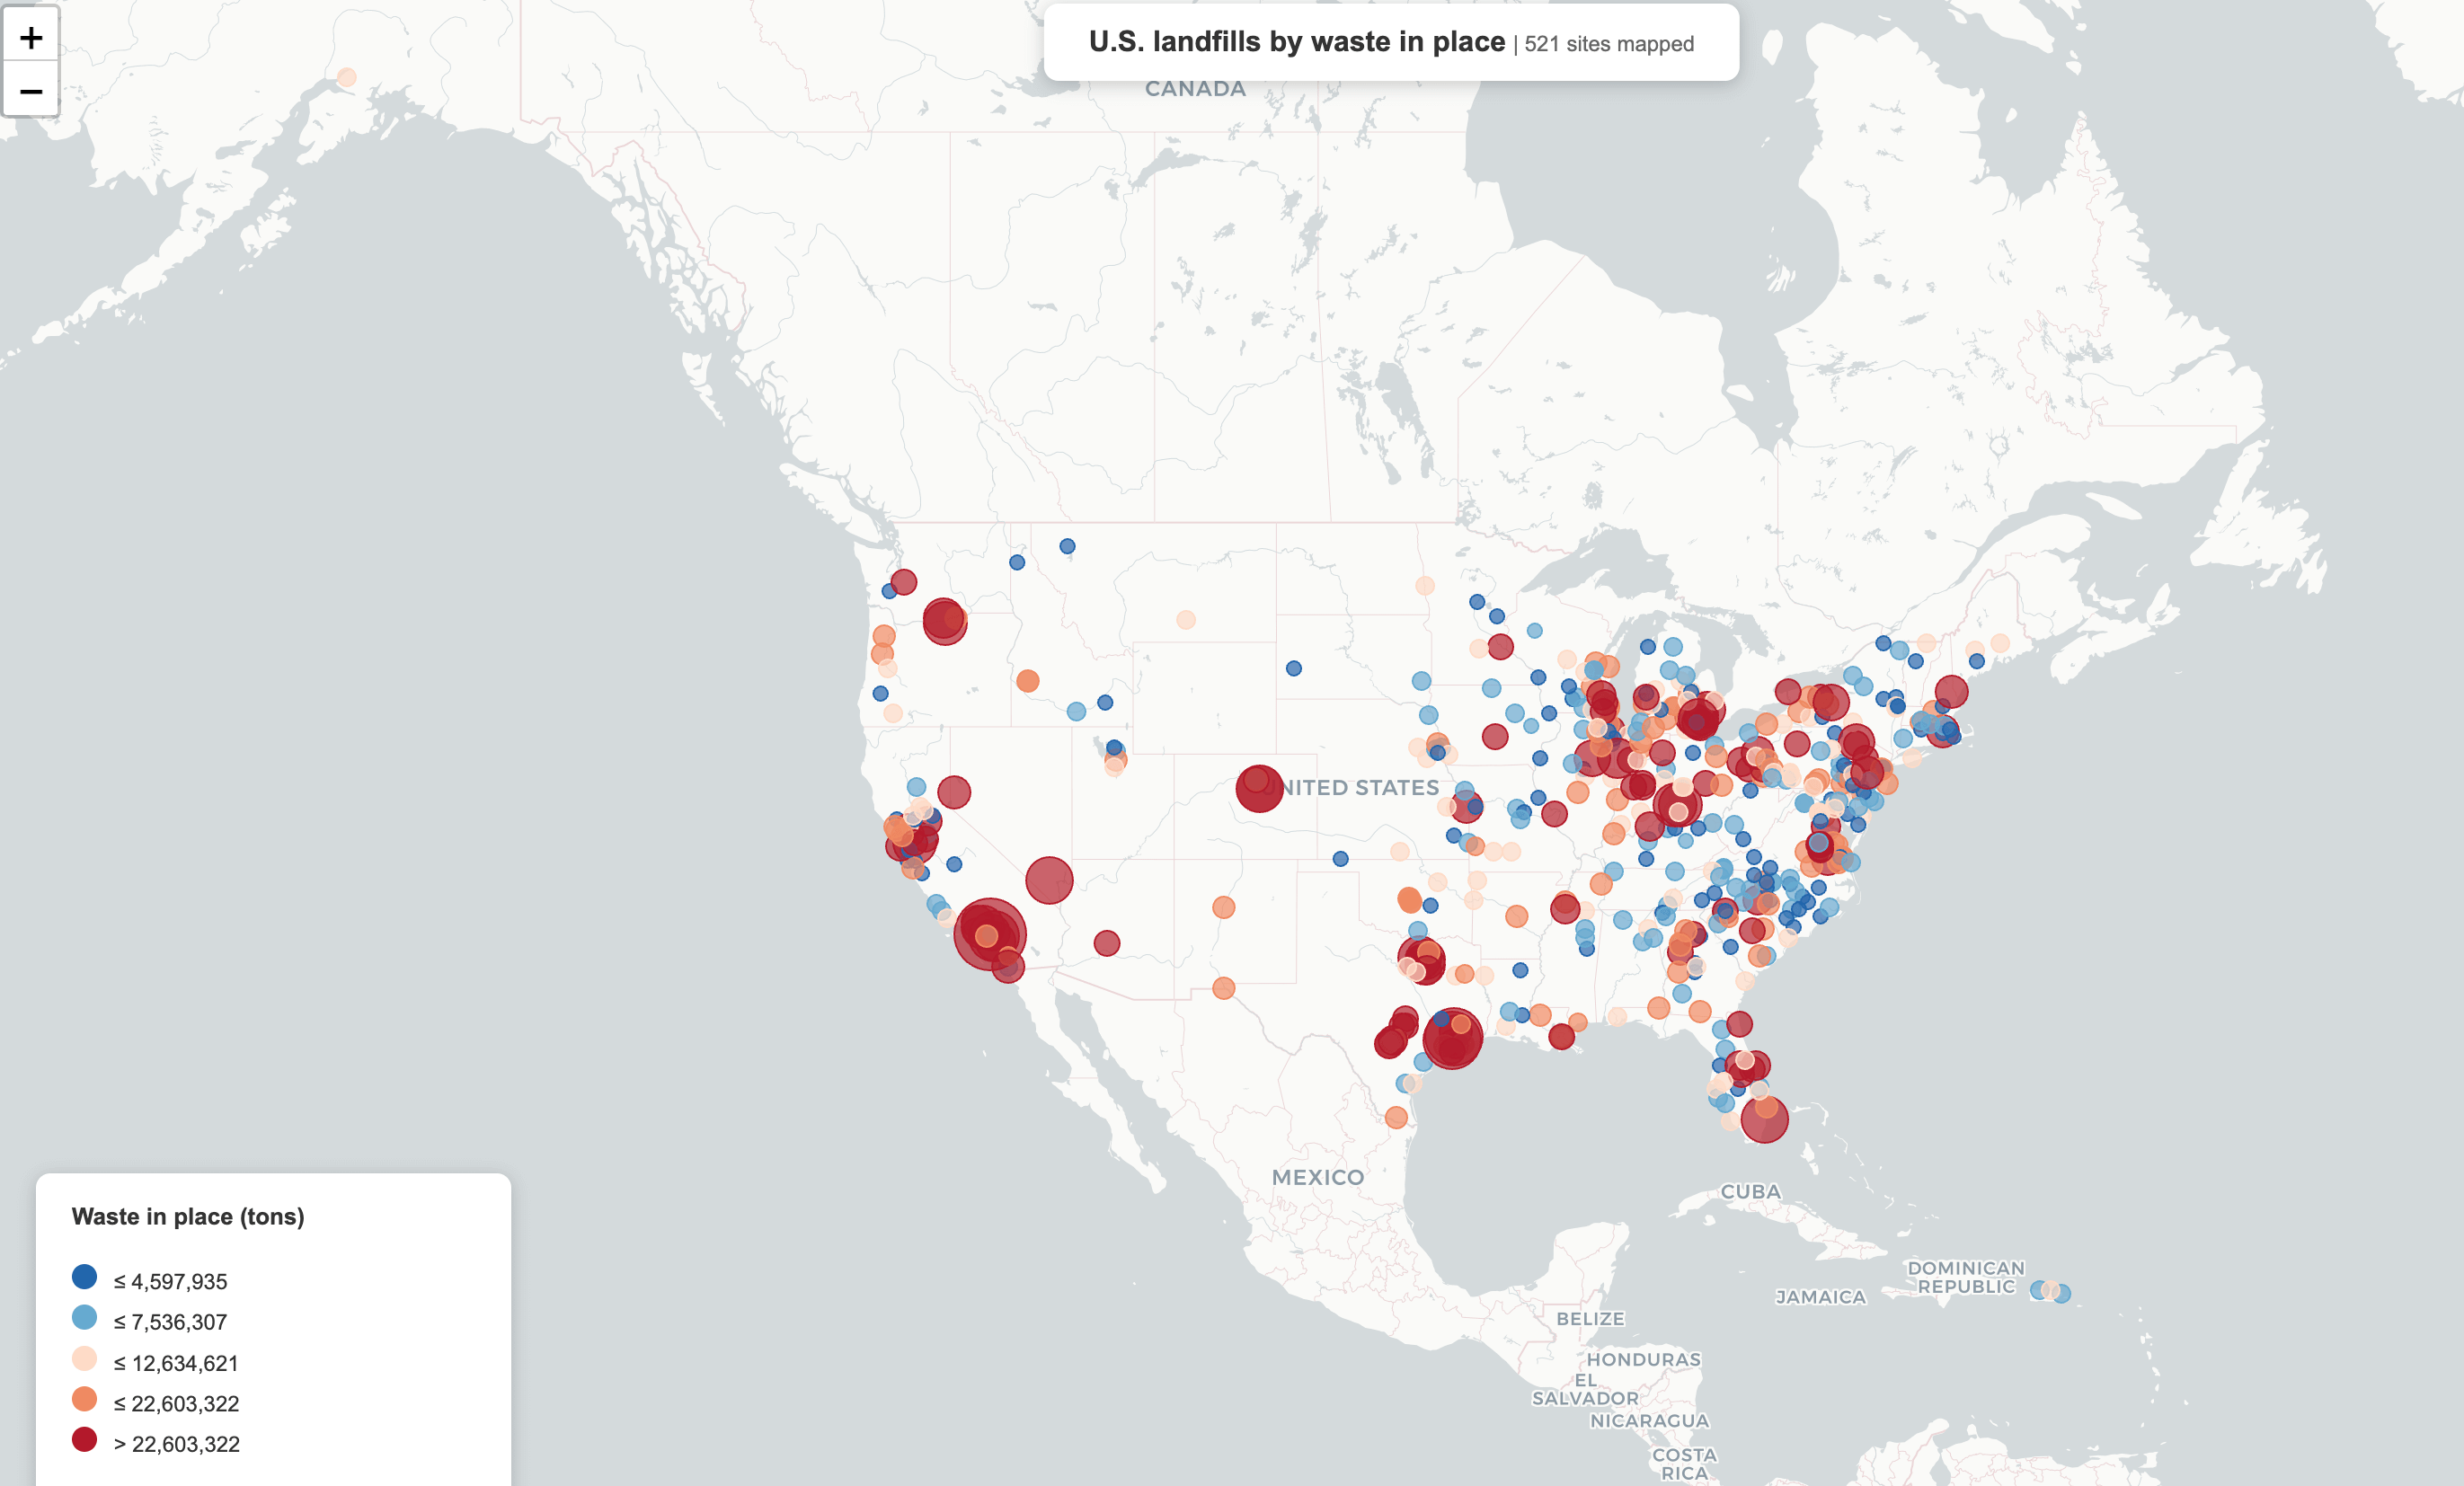
Claude gave me a color-coded legend as well as a headline that featured the number of sites plotted. I spot-checked the spreadsheet data against the interactive map and it checked out.
If you want to try the exercise yourself, you can download the landfills.csv file from this folder along with the Claude and ChatGPT examples.
Here are the prompts I used:
First prompt: Attached is a dataset with and the following columns: landfill name, state, city, county, ownership type and waste in place. Run Python code that creates a static and interactive map showing landfills according to their amount of waste.
Alternatively: Use Python to open the file and read the first 10 columns. What are some interesting questions I can ask to this dataset if my interest is “X”.
Note: I purposely left the X blank to see what it would generate a useful answer for a variable. I expected a hallucination, but it gave me questions and analysis for environmental justice, renewable energy/climate, corporate accountability and local/regional reporting.
Follow-up prompt: Now can you create a data dictionary for this dataset? (It understands what a data dictionary is.) It produced a four-page document explaining the various column headers, nearly organized in a table.
You can find more AI map creation tools on the Journalist’s Toolbox data tools page.
Sponsor

Be sure to check out the incredible production tools suite with our new sponsor at HeyNota.com
More Tools and Research
Reuters Digital News Report (2026)
New data on where news website traffic is coming from, viewer habits and more.Attesta
An iOS recorder that announces out loud that it is recording, never trains on your audio, and leaves the file yours. The output is built to be usable, not just archived: top-tier models, speaker labels, and the action items, decisions, open questions and key people pulled out accurately. You can extend a recording with Continue, and refine or restyle the summary to match how you write.Read PDF Aloud
Let AI read your PDF aloud with a natural voice. Listen to any PDF document with natural-sounding voices in 140-plus languages.Fact-Check Database
This tool from Henk van Ess lets you search through “debunked images from Reuters, Snopes, PolitiFact, AFP, BOOM Live, Lead Stories, Full Fact and more than 100 fact-checkers worldwide.” Via Craig Silverman from Indicator.media.AI Tools Box
Searchable listing of various AI tools.CrowdCounter
AI tool that estimates how many people appear in an image. Test it with some familiar images before using it on anything publishable.
Textbooks
Data + Journalism, 2nd Edition
Samantha Sunne and I co-authored the 2nd Edition of the textbook, “Data + Journalism: A Story-Driven Approach to Learning Data Reporting” that will be available in August through Routledge and other booksellers (pre-order here). It’s an introductory- to intermediate-level guide to learning data storytelling from A to Z. The second edition features new tools, datasets, exercises and AI tools.
The Journalist’s Toolbox
My book, “The Journalist’s Toolbox A Guide to Digital Reporting and AI” was published by Routledge in 2023 and focuses on concepts and tools still used today. You can order it here.

In Quotes …
“Good journalists are the ones who actually read things ... Writers who outsource their learning to AI operate on a flawed model of how the mind works.” – Ezra Klein
Follow me @itsmikereilley | @journtoolbox | Subscribe on YouTube | Subscribe to this newsletter
Copyright and Trademark 2026 | Mike Reilley