
Building Basic Charts With LLMs
March 3, 2026

Editor’s note: This is an excerpt from the upcoming 2nd edition of “Data + Journalism: A Story-Driven Approach to Data Storytelling”, which will be out late summer 2026. I also will be working with these tools at the NICAR conference this Thursday at 9 a.m. in Indianapolis. If you are there, stop by. We’ll break the internet for breakfast.
While Datawrapper, Flourish, R Studio and Canva remain my go-to chart and infographic-building tools, many AI tools have made remarkable progress in building basic static and interactive charts in the past six months.
You can build basic charts with nothing more than a clean dataset and a couple of text prompts in Claude, ChatGPT and the Data Visualization Expert Custom GPT. NotebookLM and Google Gemini Canvas were mentioned as a options in a previous newsletter, but let’s experiment with the Claude and ChatGPT for this exercise using Chicago homicide data:
Start by downloading this dataset of Chicago homicides by year (1990-2025). Open it and look over the data.
Then upload the dataset into ChatGPT or Claude. If it rejects the spreadsheet (they can be quirky sometimes), try converting it into a PDF and then use that format. Both tools can be inconsistent when working with spreadsheet formats.
Once you upload the data, use this prompt to get started: Create a static bar chart with the attached data. For the title, use “Chicago Homicides by Year (1990-2025)”. In the lower left corner, below the chart, place this text: “Source: Chicago Police Department | Chart/YOUR NAME and NAME OF LLM)
Then watch each tool do its magic by running Python code. Which LLM is better? You decide. I alternate between the two for creating charts:
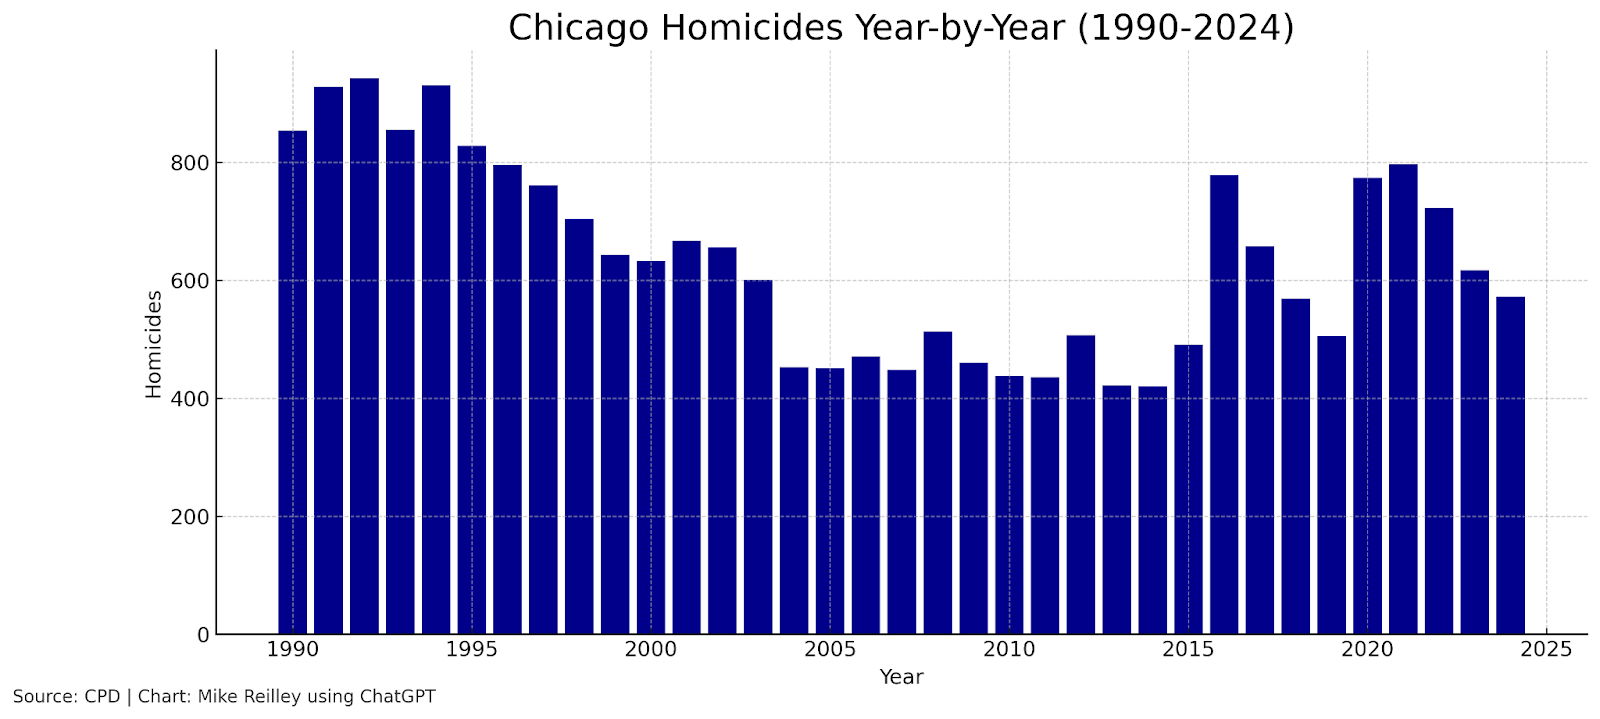
Chart by Mike Reilley and ChatGPT
You can tinker with both charts, checking spelling and adjusting colors, font types and sizes. Important: Be sure to double-check the chart data against the spreadsheet data before publishing.
To create an interactive chart, repeat the prompt above but replace the word “static” with “interactive”.
Sponsor

News Media Help Desk is a hub for local media news organizations to get digital help.
We’ll help you with free resources like case studies, how-to guides and our Scorecard database of tools. For more help, send us a note and we’ll answer your question or refer you to our fractional services partner who can match you with a vetted expert.
Visit the Help Desk at newsmediahelpdesk.org

Video
In this video, learn how to create the charts listed in the exercise above.
Sponsor

Be sure to check out the incredible production tools suite with our new sponsor at HeyNota.com

More AI tools:
Simplifying AI Newsletter
Master AI daily without the overwhelm. Join 20,000-plus professionals getting practical tutorials, trending news, and tools that actually matter.Actually Relevant News
A news curation platform that crawls more than 80 sources across five languages daily, using LLM analysis to evaluate each article’s relevance to humanity on transparent criteria. It publishes only the most relevant stories across four issue areas (Human Development, Planet and Climate, Existential Threats, Science/Technology), with every story showing a full relevance analysis. Free to use with no ads, no tracking, and no paywall — plus a free public API, RSS feeds, weekly newsletter and a positivity slider that lets readers filter by emotional tone.How 9 Facial Recognition Services Handle Images, Disclose Ownership, and More
YouTube Transcript Generator
A free, no‑login tool for instantly generating transcripts from any YouTube video. Users can extract subtitles in multiple languages, search within the transcript, and copy or download TXT, SRT, or VTT files, with or without timestamps. Designed for creators, students, researchers, and editors, it streamlines workflows by making it fast and distraction‑free to grab accurate transcripts and jump to exact moments in a video.CrowdChecker
AI tool that estimates how many people appear in an image. Test iftwith some familiar images before using it on anything publishable.

Become a sponsor: Would you like to sponsor future Journalist’s Toolbox™ newsletters? Our rates are reasonable and our sponsors get results. Contact me at mikereilley1 [at] gmail [dot] com
Textbooks
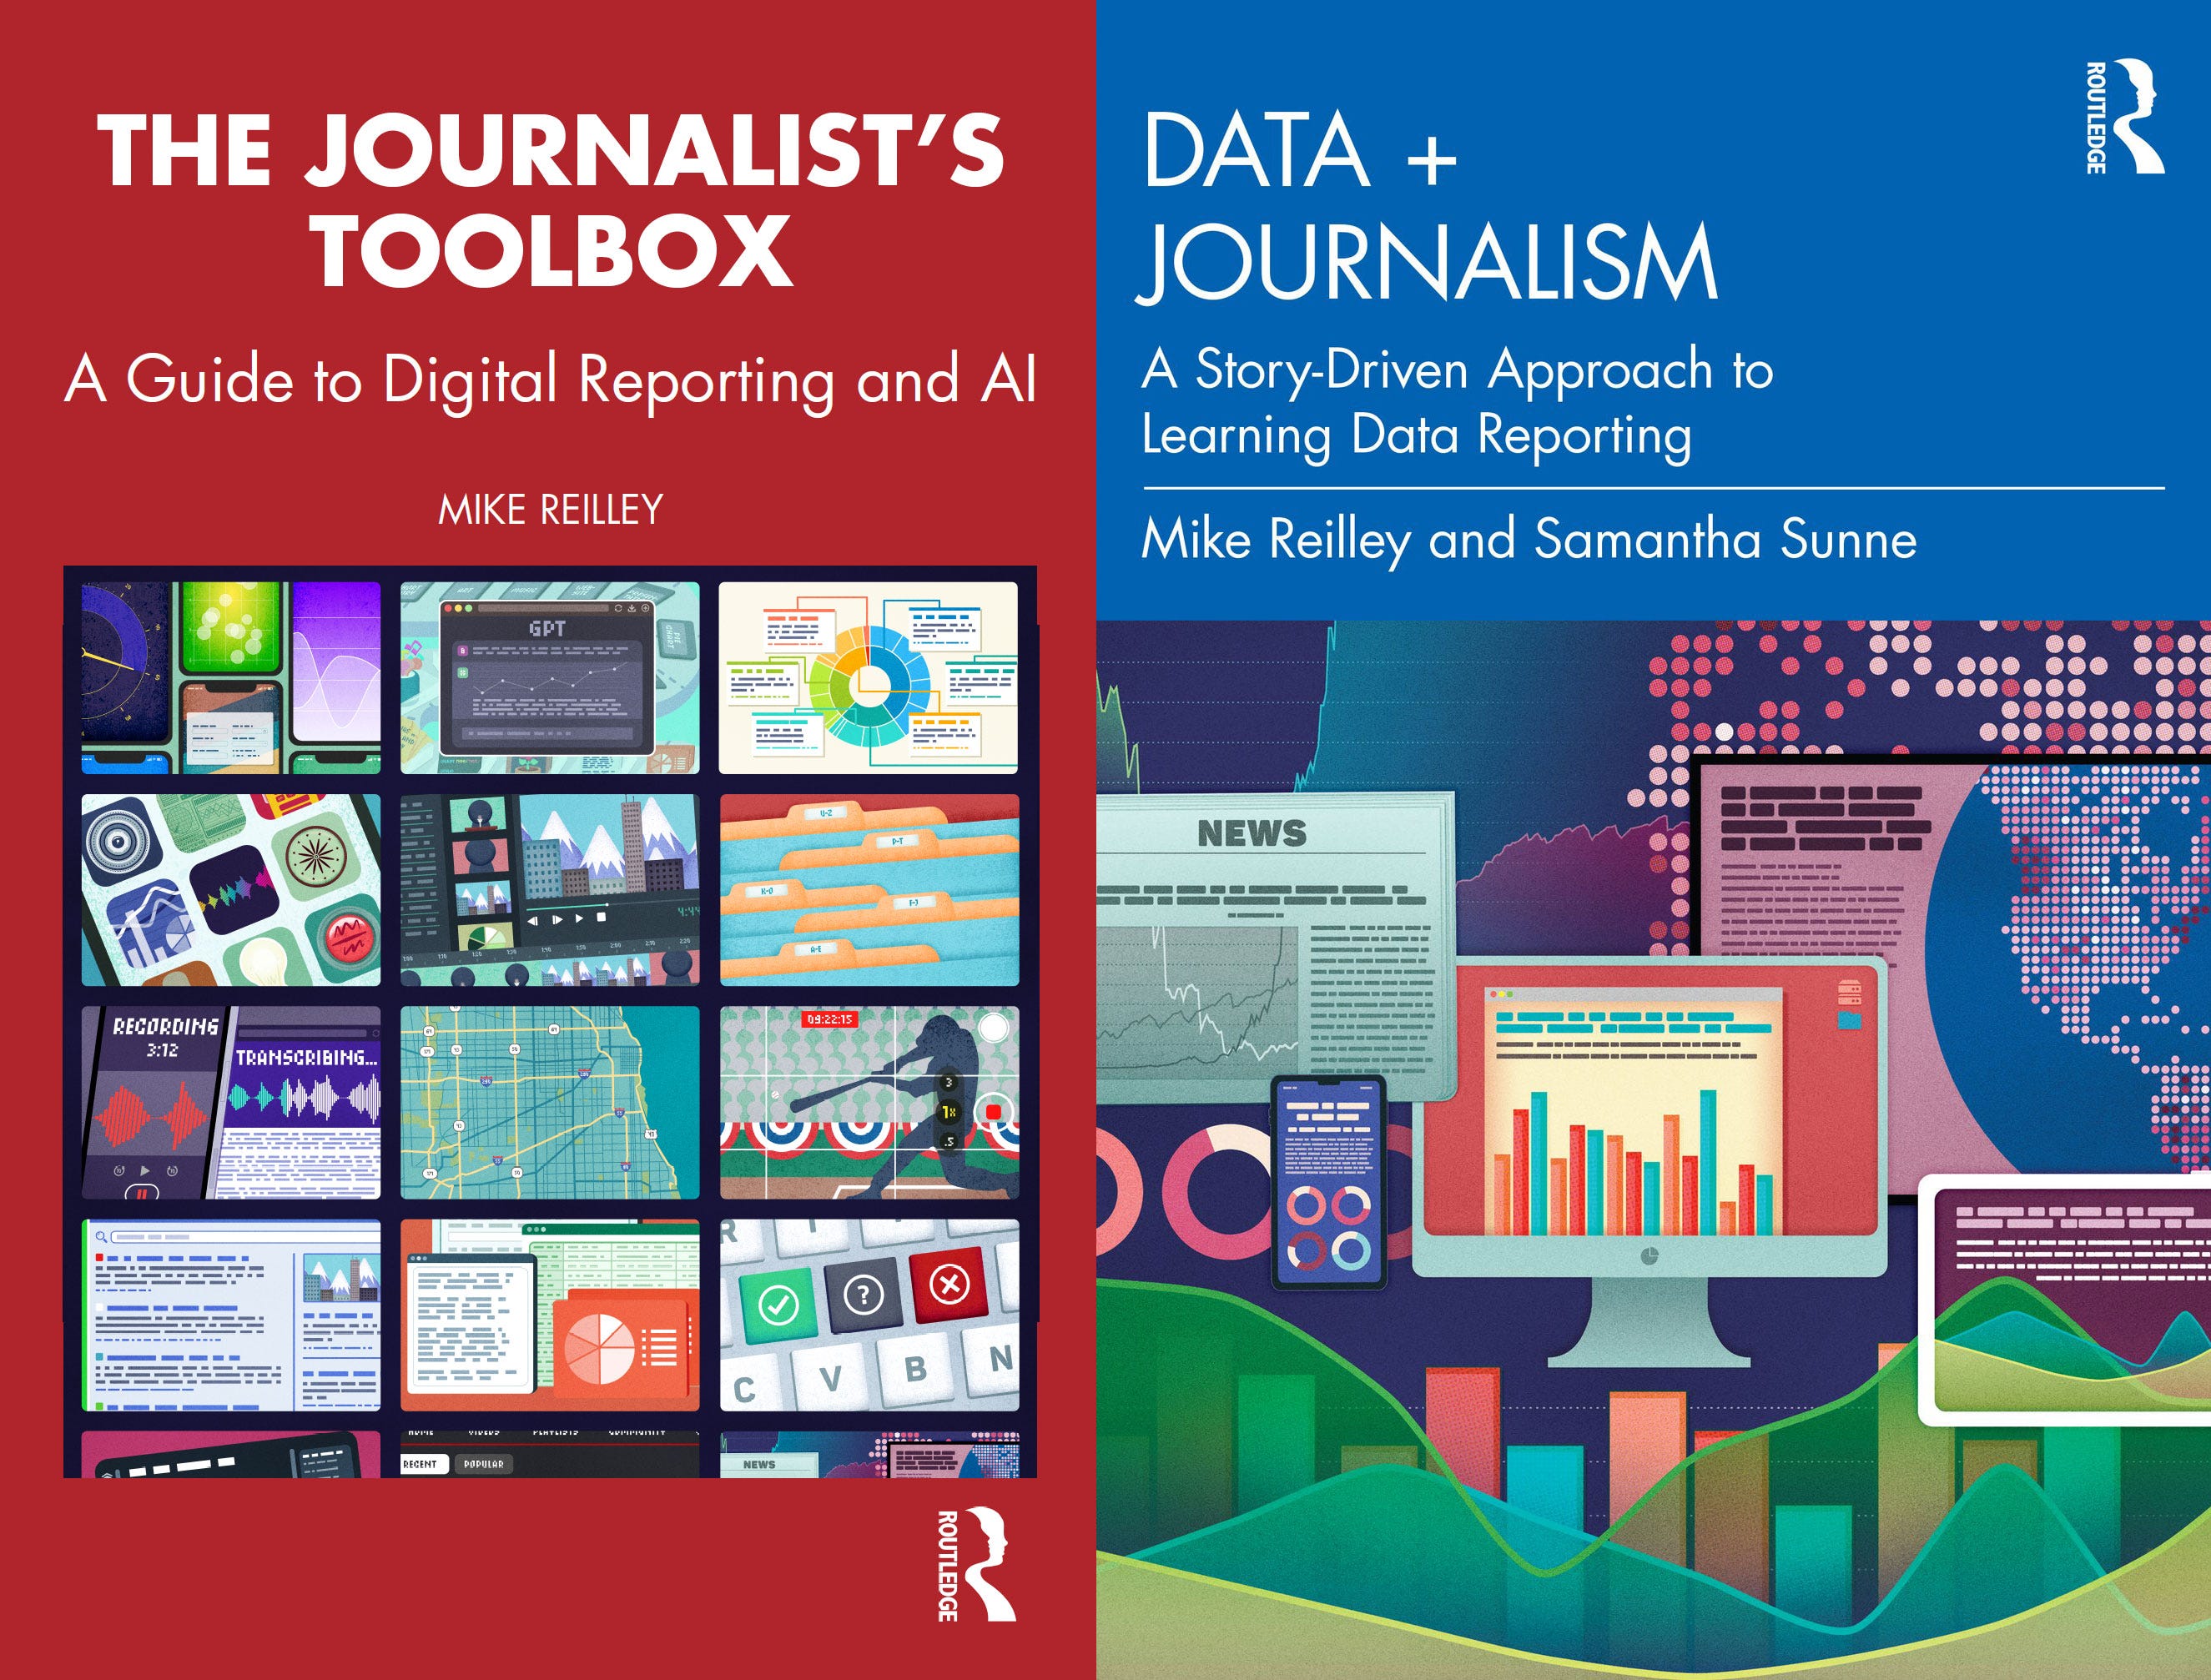
The Journalist’s Toolbox
My new book, “The Journalist’s Toolbox A Guide to Digital Reporting and AI” was published by Routledge in December. You can order it here,
Data + Journalism
Samantha Sunne and I co-authored a textbook, “Data + Journalism” that’s available now on Routledge. (Order here). It’s an introductory- to intermediate-level guide to learning data storytelling from A to Z.

In Quotes …
“Imagine a carpenter who couldn’t figure out how to adjust their table saw, or a surgeon who shrugged and said something like, ‘I’m just not a scalpel person.’ We would never accept that. But in the field of knowledge work, ‘I’m just not a tech person’ has become a permanent identity instead of a temporary gap to be filled.” — Joe Amditis on journalists’ failure to use basic technology in their jobs.
Follow me @itsmikereilley | @journtoolbox | Subscribe on YouTube | Subscribe to this newsletter
Copyright and Trademark 2026 | Mike Reilley